
Sentiment Ideas

Christmas markets are open, Outlook Season is in full swing and investors are busy implementing their 2026 views before liquidity dries up. Against that backdrop, our big picture read on sentiment hasn’t changed: it remains a supportive setup for risk assets into year-end.
Rising markets have pushed sentiment a bit deeper into bullish territory, which means the “runway” before sentiment becomes a headwind is getting shorter. Equities are back near the highs, but sentiment hasn’t fully followed — the gap has narrowed, yet sentiment still sits well below previous peaks.
You can see this in our Sentiment Matters Aggregate, which has climbed to 60 from the mid-50s post-correction. That’s constructive, but still shy of the October high of 65. Historically, this zone maps to slightly below-average 12-month returns, but without a strong directional message.
Sentiment Matters is the new home of my work on Investor Sentiment & Positioning, the mood of the market, mapped and decoded.
Sign up for free or upgrade for full access at
This relatively neutral sentiment backdrop sets the stage for the rest of this week’s update:
Sell-side strategists are releasing their 2026 targets, and the good news is that they’re reassuringly boring. Despite a multi-year bull market, there’s little sign of exuberance in the forecasts.
Retail investors, however, tell a different story: the AAII Asset Allocation Survey is starting to flash orange, with equity allocations near extremes and cash near 25-year lows.
But before we conclude retail is euphoric, the Schwab Trading Activity Index (STAX) offers a useful counterbalance — showing positioning that’s far more cautious and contrarian.
Taken together, sentiment into year-end looks supportive but not stretched, with pockets of bullishness (retail allocation), pockets of neutrality (STAX), and broadly grounded expectations on the sell side.
Get More Sentiment, More Charts, More Analysis at Sentiment Matters
www.sentiment-matters.com
Sell-Side Strategists’ 2026 Index Targets Are Reassuringly Boring
It’s Outlook Season, when every sell-side desk releases its annual tome. Cynics say these reports are mostly noise — repeating familiar lines, missing real surprises, and offering little insight into what will actually drive markets.
But pragmatic investors view Outlook Season differently.
Once a year, every sell-side institution goes through the same forecasting ritual at the same time — and publishes it.
That makes it a rare chance to measure consensus and sentiment, rather than a search for clairvoyant predictions.
As a former sell-side equity strategist who once had to publish my own index targets, I’m always curious to see where my former colleagues and competitors land.
And from a contrarian perspective, this year’s targets look… reassuringly boring.
The average upside from yesterday’s close to 2026 targets is 11%, almost exactly in line with the ~10% historical average baked into past Outlooks.
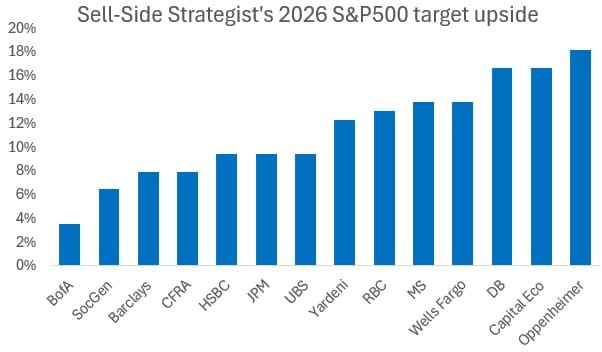
To me, that says something important: despite several years of strong equity markets, the sell side isn’t displaying excessive exuberance. Sentiment looks fairly neutral — and this far into a bull market, neutral is a quietly constructive signal.
There is one caveat: timing matters. Targets are published at different points, and what was a 10% upside at launch may look like 5% or 15% today. But across a dozen outlooks, those differences likely average out.
Bottom line
This year’s Outlooks suggest a market that is optimistic but grounded — a consensus that hasn’t drifted into froth. That’s exactly the kind of backdrop that can extend a bull market rather than end it. Sometimes, “boring” is bullish.
Get More Sentiment, More Charts, More Analysis at Sentiment Matters
www.sentiment-matters.com
Retail Investors Are Getting Very Bullish
The AAII Asset Allocation Survey Is Starting to Flash Orange
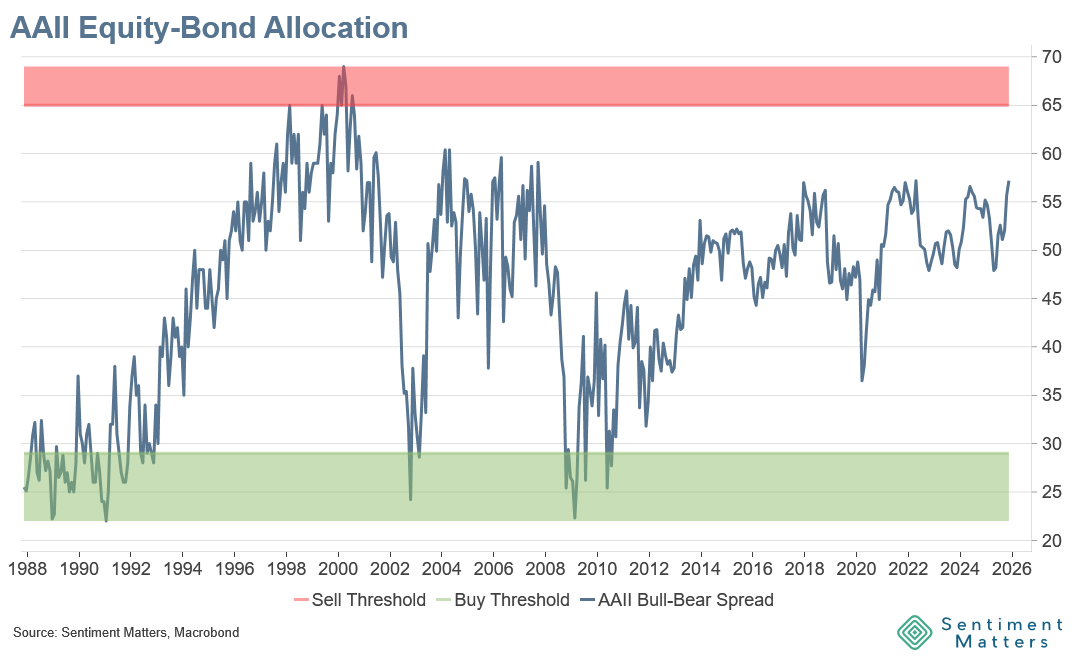
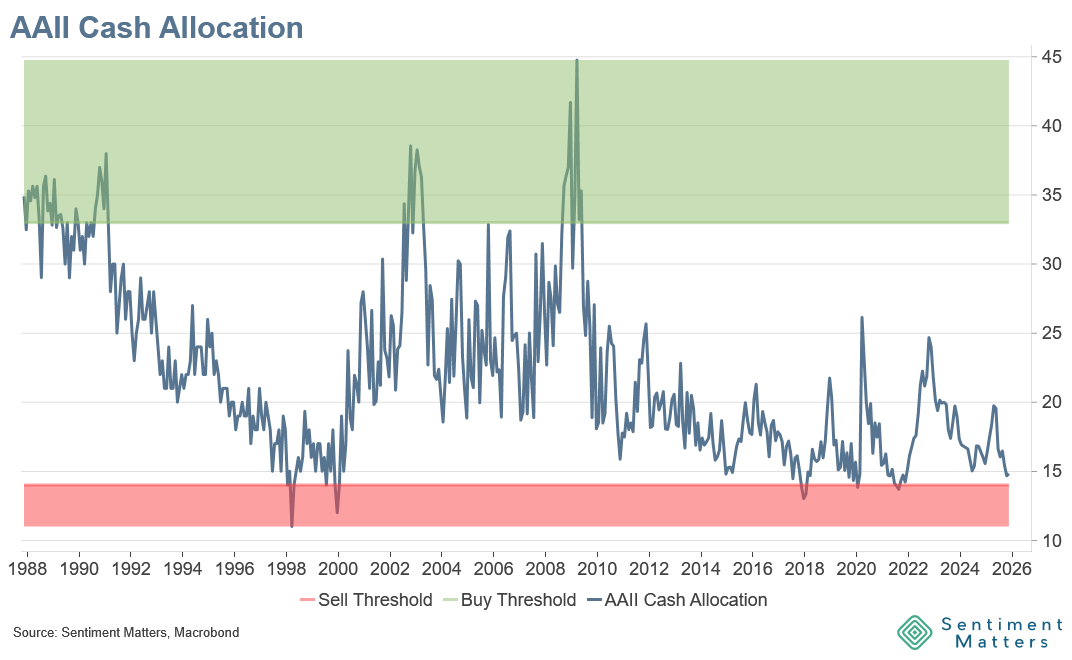
Equity allocations have jumped to 71%, bond allocations have slipped to 14%, and cash allocations are now close to 25-year lows.
That’s the message from the latest AAII Asset Allocation Survey — the lesser-known but highly useful sibling of the weekly AAII Bull–Bear survey.
Across equities, bonds, and cash, allocations are moving toward levels that have historically signalled elevated bullishness — and, lower equity returns.
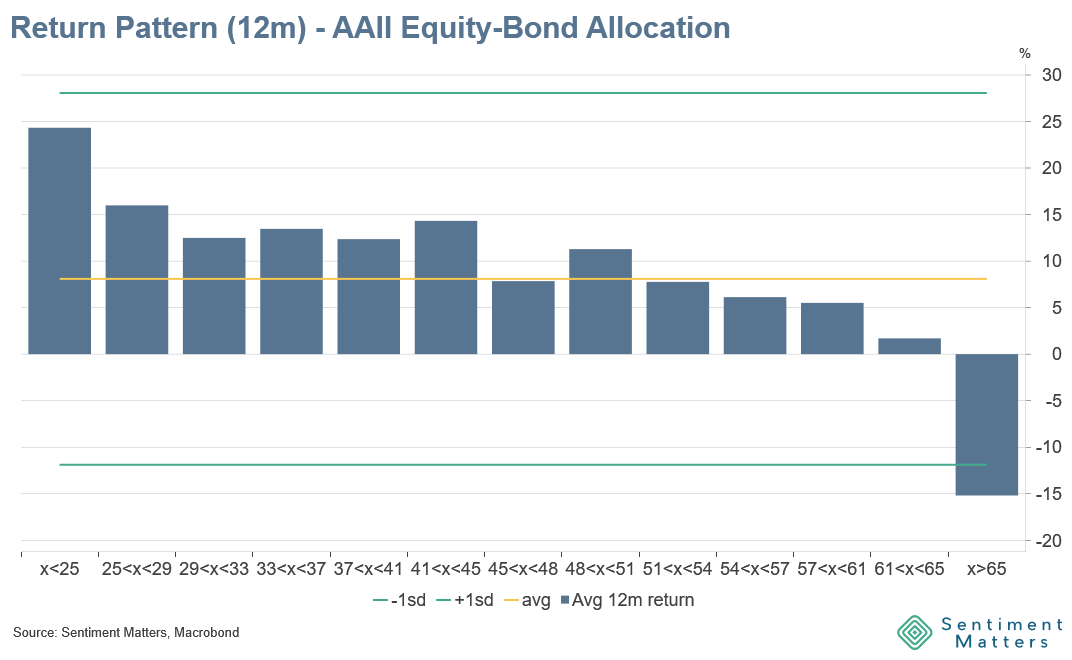
The equity–bond allocation gap is at its highest level in 19 years, sitting in the 90th percentile of its history. Historically, this has been followed by S&P 500 returns ~3% below average over the next 12 months, with 22% of outcomes more than one standard deviation below average.
Cash allocations at 14.8% are in the 6th percentile since 1987, just above the 14% historical sell threshold. Below that level, the average forward 12-month S&P 500 return has been flat, and below average 74% of the time.
Retail investors aren’t just optimistic — they’re getting very optimistic.
What You Need to Know About the AAII Asset Allocation Survey
What it is: A monthly survey of AAII members’ allocations to equities, bonds, and cash.
The good: A long history (back to 1987) and a solid track record, for buy and sell signals.
The bad: Only monthly data and relatively few signals despite the long sample.
Current message: AAII members — a retail-heavy group — are leaning increasingly bullish.
Get More Sentiment, More Charts, More Analysis at Sentiment Matters
www.sentiment-matters.com
Go deeper:
Multiple indicators from one survey
Because it captures allocations across three asset buckets, the survey offers several useful sentiment measures — including the equity–bond allocation gap.Heavy retail tilt
AAII members are primarily individual investors, making this a clean read on retail sentiment.Longer time horizon than the weekly Bull–Bear survey
The weekly survey asks about expectations over six months.
This monthly allocation survey reflects actual portfolio positioning, which tends to be stickier and slightly longer-term.Track record: it works
The survey passes the most important test:High cash, low equity, and low equity–bond gap → historically stronger forward equity returns.
Low cash, high equity and low equity–bond gap → historically weaker equity returns.
Long history
Data back to 1987, giving this survey one of the longest continuous datasets in sentiment analysis.Transparent
The question is simple:
“What % of your portfolio is in (1) equities, (2) bonds, (3) cash/cash-equivalents?”Current level
We are now close to extremes across multiple measures — especially in the equity–bond gap and cash allocations.
Bottom line
This is one of the cleanest retail sentiment indicators available — and right now, it’s flashing orange across the board.
Not outright “sell” territory yet, but certainly a sign that retail positioning is getting stretched as we head into year-end and 2026 Outlook Season.
Get More Sentiment, More Charts, More Analysis at Sentiment Matters
www.sentiment-matters.com
Schwab Retail Activity
The Schwab Trading Activity Index (STAX) paints a less bullish picture of retail sentiment than AAII.
This week’s release shows a steady recovery, but STAX remains firmly neutral — nowhere near the bullishness implied by AAII.
At 48.8, the index historically corresponds to above-average 12-month equity returns and sits well below the 2024 highs of 55 and the extreme readings in the 70s seen in 2017 and 2021.
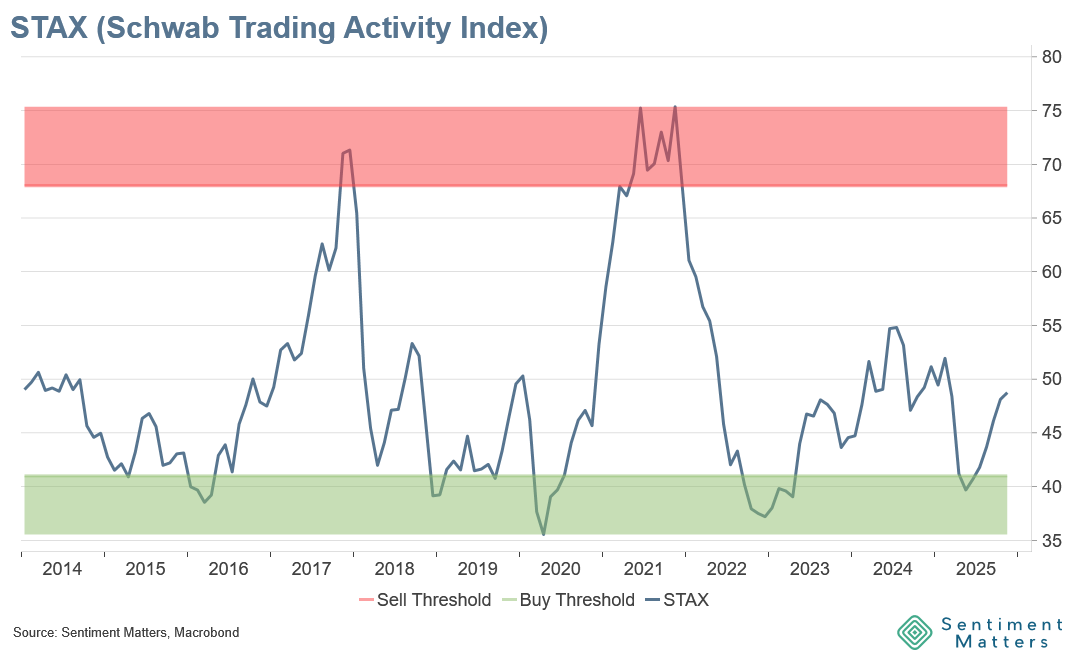
Schwab clients displayed contrarian behaviour: they bought the dip in the Magnificent Seven, were net sellers of strong performers like Communication Services, Health Care and Energy, and net buyers of Tech and Consumer Discretionary.
An interesting detail: Gen X were the most aggressively positioned cohort, while Gen Z were among the least — a reversal of the usual stereotype.
Bottom line
Overall, STAX signals a retail investor base that is cautious rather than euphoric. It’s a useful counterpoint to the more bullish AAII survey.
Get More Sentiment, More Charts, More Analysis at Sentiment Matters
www.sentiment-matters.com